Advanced View
Search results can be displayed in Advanced View mode. This mode lets you access extended features that provide a high level of report customization. All of the records found are retrieved from the server to provide fast data manipulation.

Grid features list:
- Sort
- Filtering
- Group by
- Hide a column
- Pin a column
- Adjust column position (drag-and-drop)
- Footer (Sum, Avg, Count, etc.)
- Custom column (JavaScript functions to compute and display values)
- Export (Excel, CSV, HTML, etc.)
- Save as view
- In the Portal “Views” screen:
- Link (URL, Embed)
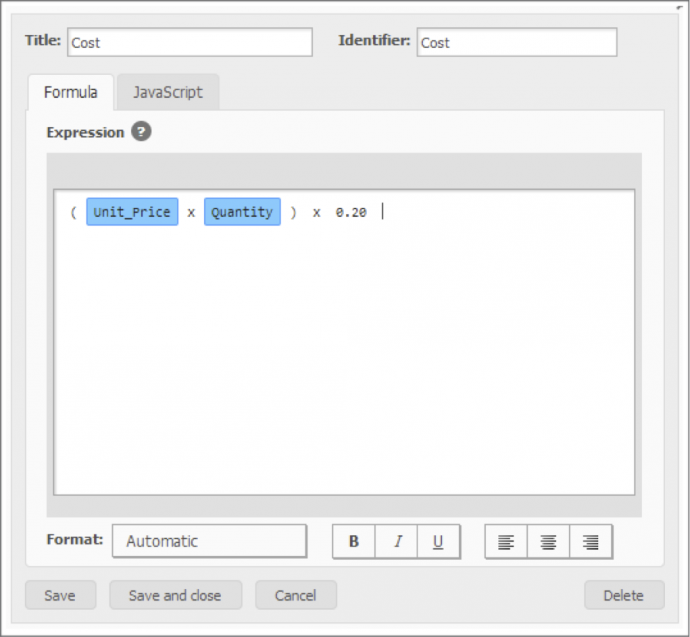
Custom columns
Advanced View lets you write your own formulas or JavaScript functions to calculate values for your custom columns.
For instructions on creating custom columns, see the Advanced View custom columns topic.
Custom charts
The Custom Charts feature lets you create customized charts with your data grid using JavaScript. You can create a chart with any chart library.
Timetable chart example

Gauge example

For instructions on creating custom charts, see the Advanced View custom charts topic.
Dashboard
The Dashboard feature lets users display views as floating panels on the home page. The home page can be saved as a view.

For instructions on how to use the Dashboard, see the How to use the Dashboard topic.
Reporting via SQL views
The reporting module aims to provide efficient SQL views allowing you to perform advanced reports based on external reporting tools (e.g. Business Objects).
Available views:
-
DATA: These views contain information about the relevant data of the tested and real requests.
-
ACTION: The information about the different actions which compose each request, are stored in these views which allow you to follow the flow of the actions
-
DIR: You can retrieve in these views the information concerning WorkflowGen users, groups, and directories, as well as their relationships.
You can set up a dedicated reporting database which will provide specific tables containing the data retrieved from the views. These tables allow a better performance level and have no impact on the production database.
Creating custom reports with the WorkflowGen Reporting Module
The reporting module provides efficient SQL views that allow you to create advanced reports based on reporting tools (Crystal reports, Business Object, Cognos, etc.).
Available views:
-
DATA: These views contain information on the relevant data of the tested and real requests.
-
ACTION: The information about the different actions that make up each request, are stored in these views which allow you to follow the flow of the actions
-
DIR: These views retrieve information on the WorkflowGen users, groups, and directories, as well as their relationships.
You can set up a reporting dedicated database to provide specific tables containing the data retrieved from the views. These tables allow a better performance level and have no impact on the production database.
See the Reporting Module topic to download Reporting Module installation packs and documentation (for WorkflowGen 5.4 and later only).
See the WorkflowGen Technical Reference Guide for information on the installation and configuration procedures and the directories and files installed.
